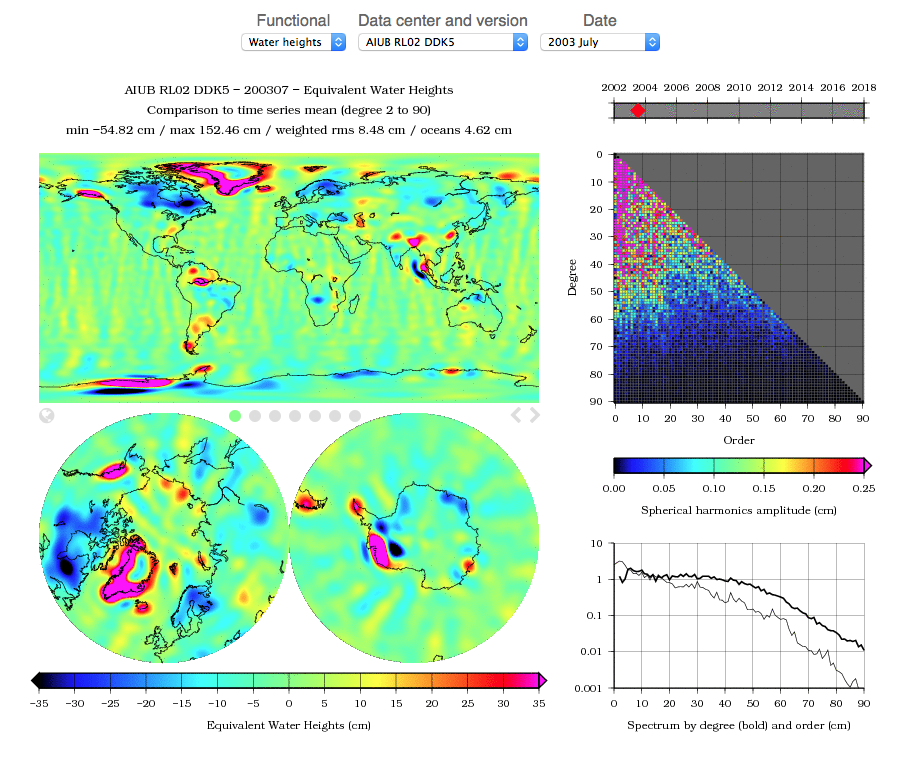
Readers already know our geographical extraction page for GRACE time-series, available at plot.egsiem.eu. In addition to this feature, we now add the possibility to easily visualize images of the GRACE solutions, in the form of grids of geoid heights and equivalent water heights. You will thus be able to browse images of solutions from the different groups of the project (AIUB, CNES, GFZ, TUGRAZ), and from some other centers (CSR, JPL).
The images include grids in rectangular and polar projections, as well as spherical harmonics amplitude and spectrum in degree and order. We are also adding another new page called «Statistics», where we will upload interesting statistics about the GRACE mission and our project. As a start, we provide the GRACE altitude and the GRACE inter satellite distance, but we will continue to update it with more extensive data in the upcoming weeks and months.
Please visit us at plot.egsiem.eu to discover these stunning new functionalities!