The Astronomical Institute of the University of Bern has been hosting a student from a local school (Gymnasium Kirchenfeld) who has been using the EGSIEM Plotter to extract time-varying signals from all over the globe.
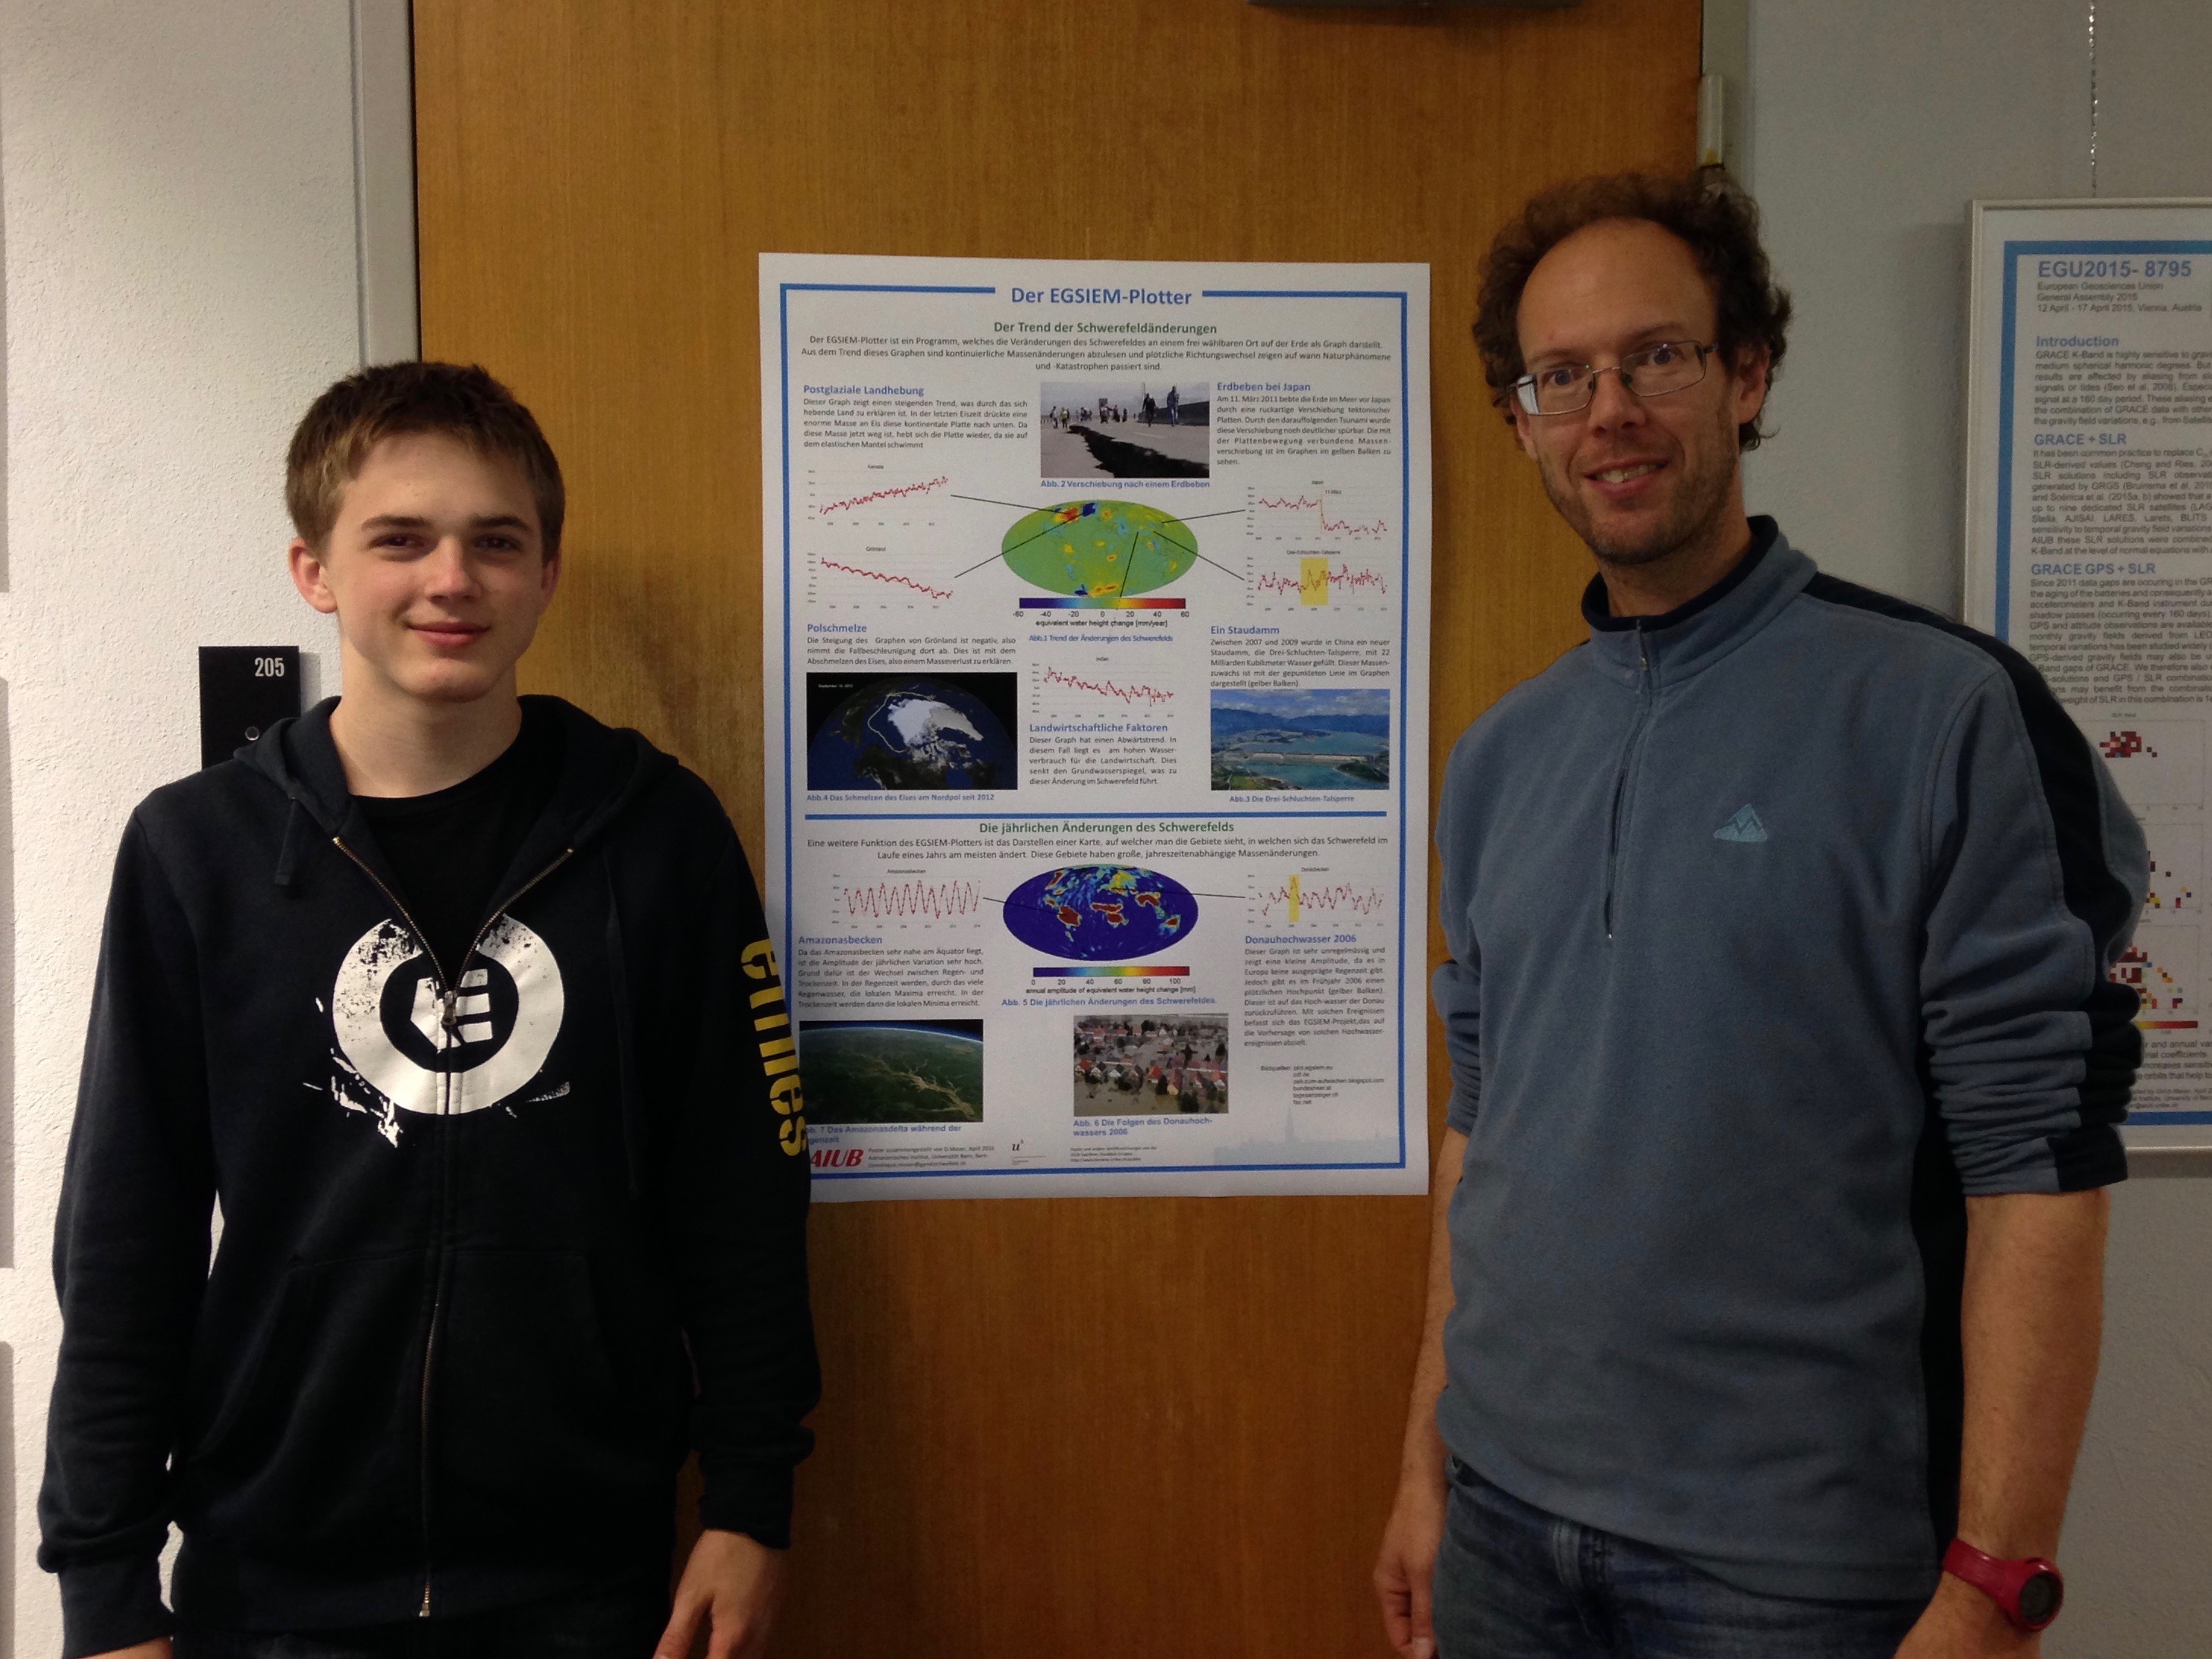
Dominique Moser’s (above left) work has been conducted under the supervision of Dr. Uli Meyer (above right) in Bern. Dominique has been using the EGSIEM Plotter to discover more about how natural disasters can be seen (and one day we hope, predicted) using data gained from Earth Observations. The EGSIEM Plotter makes an excellent tool with which to view these natural events, Dominique (who is 16) said that the plotter “…was quite simple, though there were a few things which I needed to get used to.”
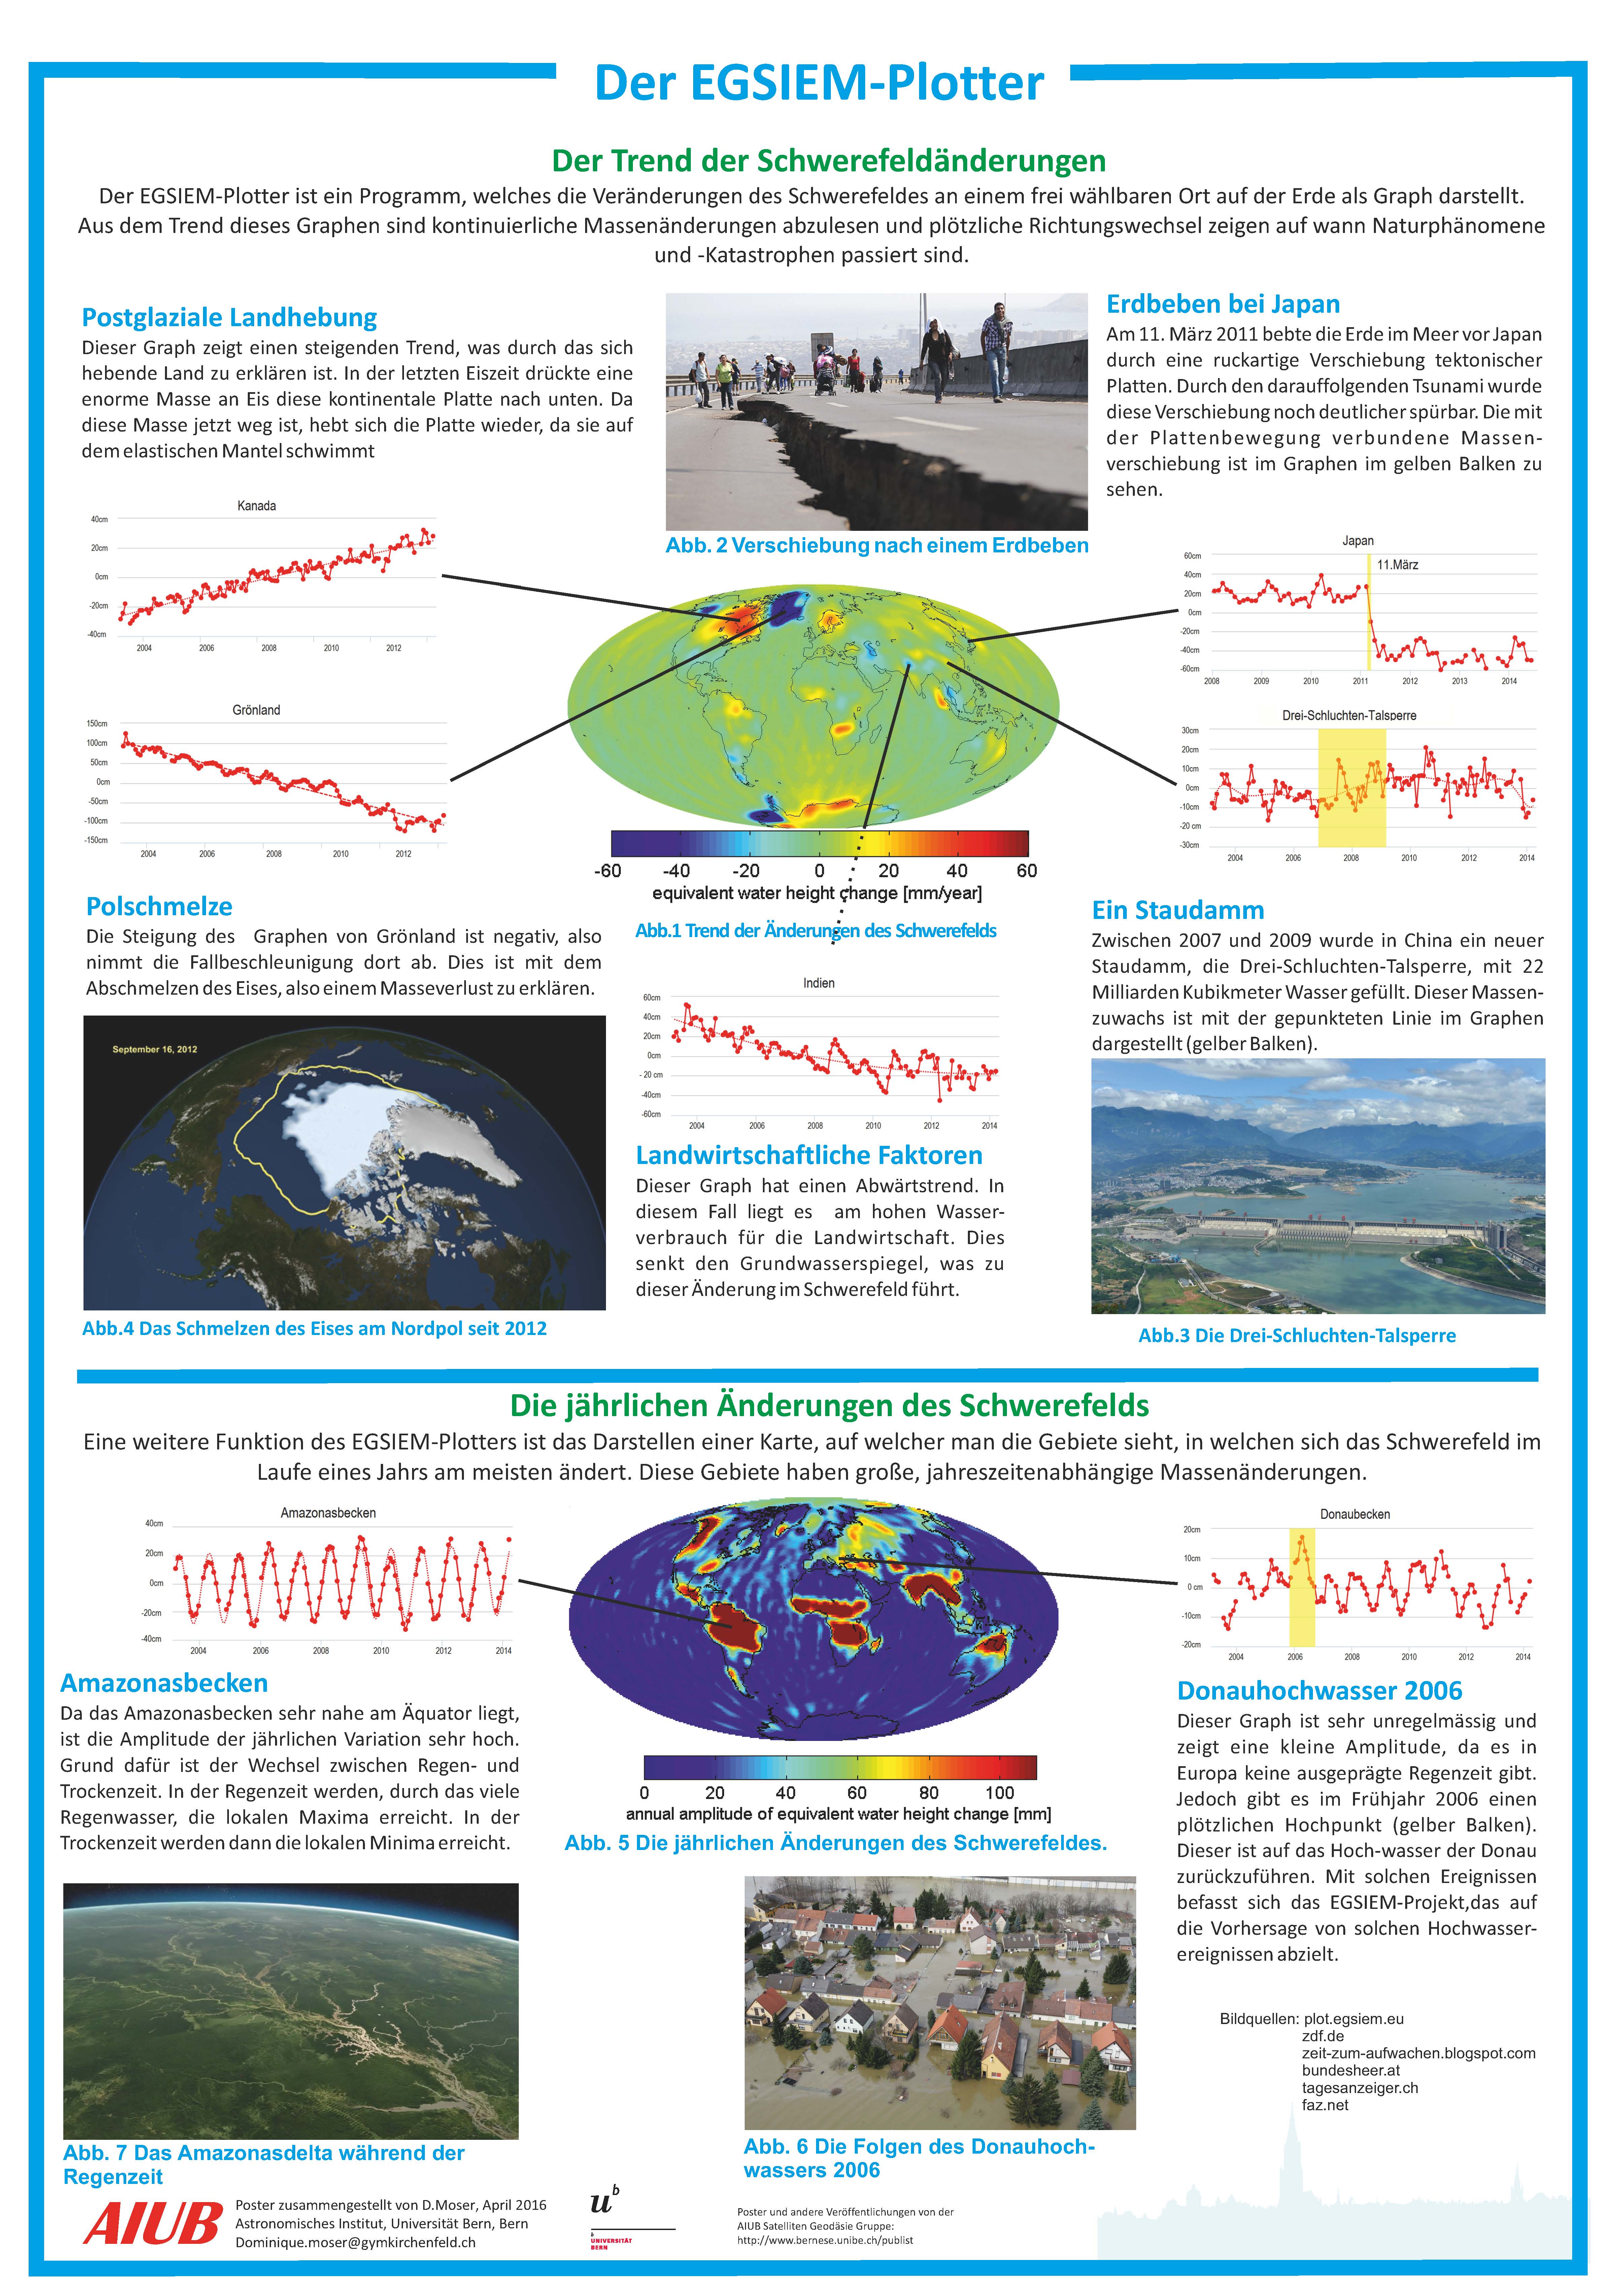
His excellent poster (below, in German) will now be displayed at his school, and we hope many other students will be able to use the EGSIEM Plotter to discover more about what gravity data can tell us.