Warning: "continue" targeting switch is equivalent to "break". Did you mean to use "continue 2"? in /home/httpd/vhosts/egsiem.eu/httpdocs/plugins/system/t3/includes/menu/megamenu.php on line 141 News
Home

The acceleration approach – an alternative way of processing GRACE data

What is the acceleration approach?
The acceleration approach is based on Newton’s equation of motion, i.e. the kinematic observations are linked to the dynamics = forces. Practically it means that we either need to observe accelerations directly, e.g. by accelerometers, or we need to derive them from other type of observations e.g. by numerical differentiation from positions. Since we are interested in the recovery of one particular force, namely the gravity field and its temporal variations, all other forces need to be subtracted by using e.g. models.

Since all Earth observing systems must refer to one and the same reference frame, the establishment of an improved reference frame is an important prerequisite for precise orbit and gravity field determination, and Earth studies in general. Based on improved models we have at AUIB started to process data from more than 250 globally distributed stations belonging to the network of the International GNSS Service (IGS). The time span of the processing is covering the period from 1994 to recent years. Additionally, to ensure high quality products for the purposes of EGSIEM, the orbital products are validated using Satellite Laser Ranging (SLR) observations.

EGSIEM aims at using gravity field analysis for forecasting and mapping of hydrological extremes like large-scale draughts and flood events. Observations of the redistribution of water and ice mass derived from the current GRACE mission, the future GRACE-FO mission and additional data are not part of the inventory of EO data products to date, although they constitute a new and unique remote sensing opportunity with innovative approaches to flood and drought monitoring and forecasting. Traditional earth observation resources for monitoring large scale disasters and disaster response based on weather satellites or optical and SAR satellites are provided by mechanisms and services such as the International Charter, the European Copernicus Emergency Management Service or Sentinel Asia, for example. This year the International Charter "Space and Major Disasters“ celebrates its 15th anniversary.

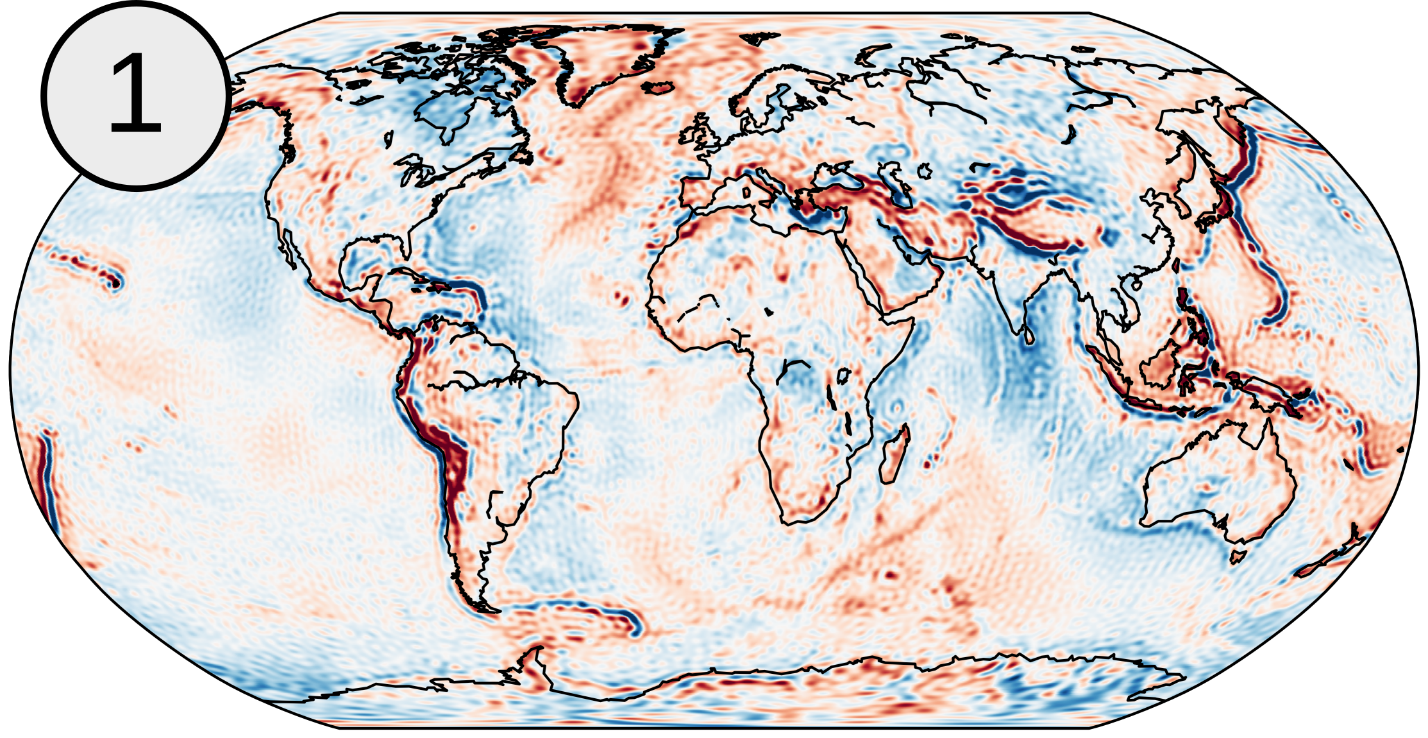
As you may have already discovered from the previous blog entries on the EGSIEM site, the Earth’s gravity field is a fascinating thing. Since gravitation itself is a pretty abstract concept, one might ask how do we actually visualize our gravity field solutions. Some representations like gravity maps (Figure 1)

"Attitude is a little thing that makes a big difference." Sir Winston Churchill

The precise attitude determination and control (ADC) is one of the key tasks for almost every satellite mission. Attitude determination is a process of estimating the attitude based on sensor measurement. Attitude control is then a process of maintaining or changing the attitude using either natural forces or actuators. The attitude is to be distinguished from the position. The position of a spacecraft informs us about where the satellite’s center of mass is located in space, whereas the attitude describes the motion about this center of mass.

Last week’s hot spell over large parts of Europe may have triggered memories of the heatwaves in the summers of 2003 and 2006. Over a number of days many European cities recorded peak temperatures in the year thus far, including Madrid (39.9 °C), Paris (39.7 °C), Berlin (37.9 °C) and London-Heathrow (36.7 °C). While definitions may vary somewhat regionally, a heatwave is generally described as a period of a number of consecutive days when the daily maximum temperature exceeds the average maximum temperature or a set maximum temperature by a set number of degrees. According to the World Meteorological Organization a heatwave occurs “when the daily maximum temperature of more than five consecutive days exceeds the average by 5 °C, the normal being 1961-1990.” If last week’s weather conditions signaled the start of a period of drought in Europe, however, is yet another story.

The EGSIEM Plotter development team is delighted to announce some brand new features which have been added to plot.egsiem.eu, these include:


- GRACE monthly gravity data has been incorporated from Universität Bern (UBERN), Centre national d’études Spatiales (CNES), Center for Space Research, The University of Texas at Austin (CSR), Deutsche GeoForschungsZentrum (GFZ), Jet Propulsion Laboratory (JPL) and Technische Universität Graz (TUG)

Why do we use hydrological models?
GRACE allows for the first time to quantify mass variations caused by changes in continental water storage (CWS). To ensure the quality of EGSIEM products, hydrology validation is essential, since these model-based hydrological data could help us to identify outliers, and more importantly increase user’s confidence in our data products.

Each year, the geodesy institutes at TU Graz host the geoday, an outreach event targeted at students about to graduate high school. This year over 200 students from schools all over Styria took the opportunity to get to know the courses of study, the geodesy institutes at TUG, and their current research topics. Besides regional and lunar gravity field recovery, GRACE and the monitoring of the time variable gravity field were hot topics at our booth. We engaged the students with interactive displays of satellite models and gravity products which sparked many interesting discussions.

The GRACE satellites are flying at an altitude of approximately 400 km above the Earth's surface. Due to the attenuation of the gravitational perturbations with altitude, they sense "large scale" variations in the gravity field, to say it simply, rather than "small scale". The smallest perturbations on the Earth surface that they can observe on a monthly basis have a spatial extent of at least 200 to 300 km. In addition to that, the North - South orientation of the tracks - and of the measurements taken by the satellites - imply that there is a weakness in the determination of the East - West components of the solutions. This weakness needs to be in some way alleviated.

Severe and very large flood events, such as the floods in central Europe in 2002 and 2013 or the flood in Pakistan in 2010 for example, are amongst the most devastating catastrophes for the Earth's population, economy and environment. According to the number of activations of the International Charter Space and Major Disasters, almost 50 percent of all major disasters during the last 15 years have been flood events.

Due to their capability to present a synoptic view of the spatial extent of floods, satellite remote sensing technology has been successfully applied for flood mapping and monitoring applications. Because of their specific illumination, their day/night as well as all-weather capabilities, synthetic aperture radar (SAR) sensors (e.g. TerraSAR-X, Radarsat-2, ALOS-2 which all operate in different wavelengths, i.e. X,C and L-band) are optimally suited for providing reliable information on floods, which usually occur under rainy or at least cloudy conditions. In recent years, the global demand for crisis information on natural disasters like severe flood events has increased substantially.